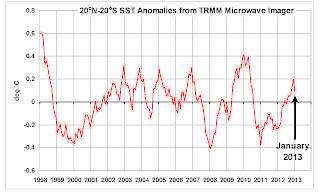
An index value plot does not give exact data points and instead plots onto a line graph and indexed value. It gives a normal line off which the reader can base the other distributed indexed data on. This index value plot shows the degree of variation in anomalies from a TRMM microwave imager as it relates to time.
No comments:
Post a Comment